4.8 KiB
| layout | title | description | keywords | nav | image |
|---|---|---|---|---|---|
| default | How to run and what you will get. | Examples of what you will get if you run sitespeed.io, browsertime, coach and PageXray. | sitespeed.io, examples, results, wpo, web performance optimization | examples | https://www.sitespeed.io/img/sitespeed-2.0-twitter.png |
Examples
{:.no_toc}
- Lets place the TOC here {:toc}
sitespeed.io
Sitespeed.io uses Browsertime, the Coach and PageXray to collect and generate the result, so looking at result pages from sitespeed.io will give you a idea of what you can get from all tools. Analyzing two pages using Chrome looks like this:
docker run --shm-size=1g --rm -v "$(pwd)":/sitespeed.io sitespeedio/sitespeed.io -b chrome --video --speedIndex https://en.wikipedia.org/wiki/Main_Page https://en.wikipedia.org/wiki/Barack_Obama
Gives the following report. The standard use case for sitespeed.io is to run it continously and send the data to Graphite/Grafana and create dashboards looking like this:
 {: .img-thumbnail}
Checkout our example dashboard to see what it looks like to use sitespeed.io to continuously measure performance.
{: .img-thumbnail}
Checkout our example dashboard to see what it looks like to use sitespeed.io to continuously measure performance.
Browsertime
Browsertime collects metrics using JavaScript and will record the browser window using FFMPED and produce a JSON file with the metrics collected, a HAR file that describes the request/responses and video and screenshots.
docker run --shm-size=1g --rm -v "$(pwd)":/browsertime sitespeedio/browsertime --video --speedIndex https://www.sitespeed.io/
Coach
Compare
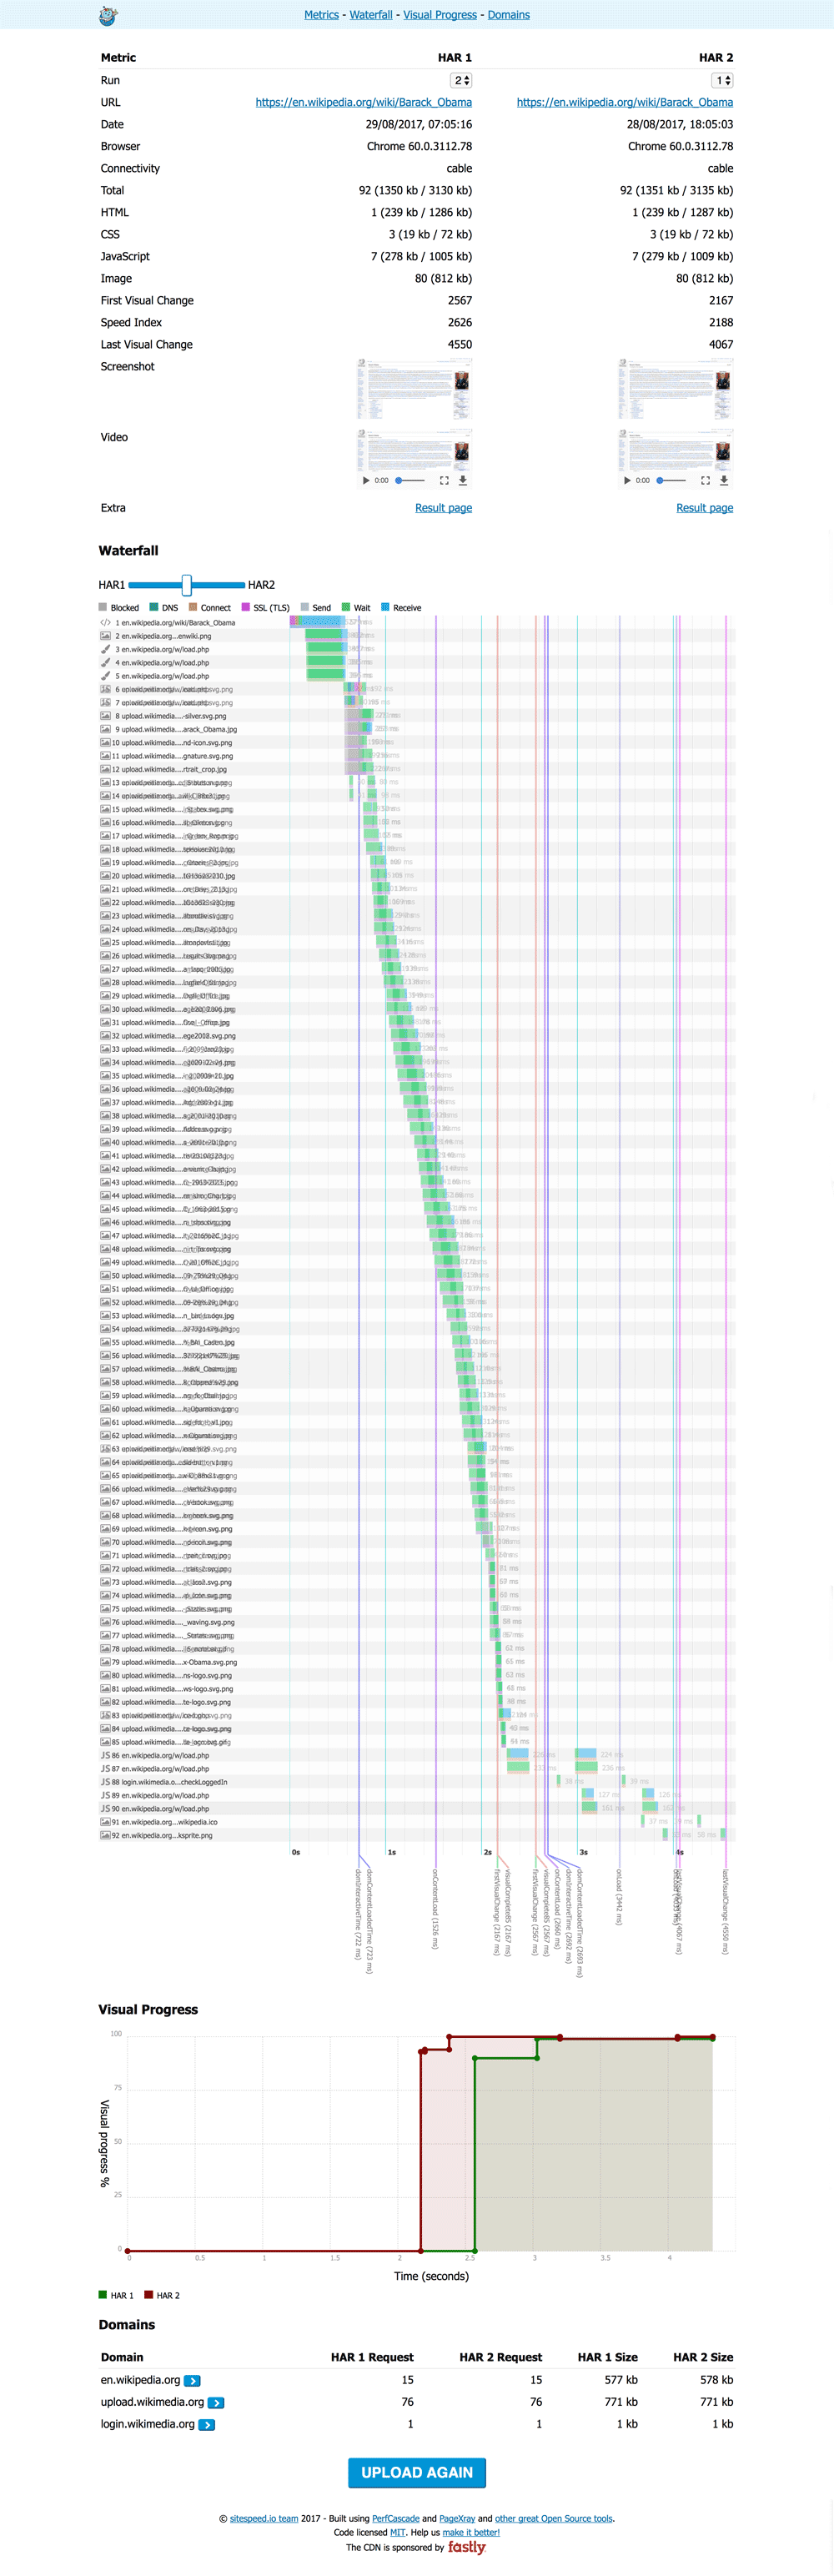 {: .img-thumbnail}
PageXray
PageXray will convert your HAR file to a new JSON format. If your HAR file is from WebPageTest or Browsertime it will pickup some extra info.
Run it locally in NodeJS or in the browser:
pagexray --pretty /path/to/my.har
Will convert the HAR to the following structure:
[
  {
    "url": "https://www.sitespeed.io/",
    "meta": {
      "browser": {
        "name": "Chrome",
        "version": "60.0.3112.78"
      },
      "startedDateTime": "2017-08-24T18:26:29.077Z",
      "connectivity": "native",
      "title": "Sitespeed.io - Welcome to the wonderful world of Web Performance run 1"
    },
    "finalUrl": "https://www.sitespeed.io/",
    "baseDomain": "www.sitespeed.io",
    "documentRedirects": 0,
    "redirectChain": [],
    "transferSize": 98791,
    "contentSize": 120776,
    "headerSize": 0,
    "requests": 10,
    "missingCompression": 0,
    "httpType": "h2",
    "httpVersion": "HTTP/2.0",
    "contentTypes": {
      "html": {
        "transferSize": 8479,
        "contentSize": 28279,
        "headerSize": 0,
        "requests": 1
      },
      "css": {
        "transferSize": 0,
        "contentSize": 0,
        "headerSize": 0,
        "requests": 0
      },
      "javascript": {
        "transferSize": 0,
        "contentSize": 0,
        "headerSize": 0,
        "requests": 0
      },
      "image": {
        "transferSize": 87309,
        "contentSize": 85979,
        "headerSize": 0,
        "requests": 8
      },
      "font": {
        "transferSize": 0,
        "contentSize": 0,
        "headerSize": 0,
        "requests": 0
      },
      "favicon": {
        "transferSize": 3003,
        "contentSize": 6518,
        "headerSize": 0,
        "requests": 1
      }
    },
    "assets": [],
    "responseCodes": {
      "200": 10
    },
    "firstParty": {},
    "thirdParty": {},
    "domains": {
      "www.sitespeed.io": {
        "transferSize": 98791,
        "contentSize": 120776,
        "headerSize": -10,
        "requests": 10,
        "timings": {
          "blocked": 169,
          "dns": 0,
          "connect": 0,
          "send": 6,
          "wait": 3624,
          "receive": 104
        }
      }
    },
    "expireStats": {
      "min": 600,
      "median": 31536000,
      "max": 31536000,
      "total": 283824600,
      "values": 10
    },
    "lastModifiedStats": {
      "min": 733347,
      "median": 733444,
      "max": 733480,
      "total": 7334359,
      "values": 10
    },
    "cookieStats": {
      "min": 0,
      "median": 0,
      "max": 0,
      "total": 0,
      "values": 10
    },
    "totalDomains": 1,
    "visualMetrics": {
      "FirstVisualChange": 617,
      "SpeedIndex": 625,
      "VisualComplete85": 617,
      "LastVisualChange": 1033,
      "VisualProgress": {
        "0": 0,
        "617": 98,
        "633": 98,
        "667": 98,
        "850": 98,
        "1033": 100
      }
    }
  }
]