|
|
||
|---|---|---|
| .github | ||
| bin | ||
| docker | ||
| docs | ||
| lib | ||
| test | ||
| tools | ||
| .dockerignore | ||
| .editorconfig | ||
| .eslintignore | ||
| .eslintrc.json | ||
| .gitignore | ||
| .netlify | ||
| .pug-lintrc | ||
| .travis.yml | ||
| CHANGELOG.md | ||
| CODE_OF_CONDUCT.md | ||
| CONTRIBUTORS.md | ||
| Dockerfile | ||
| Gemfile | ||
| Gemfile.lock | ||
| HELP.md | ||
| LICENSE | ||
| README.md | ||
| ROADMAP.md | ||
| npm-shrinkwrap.json | ||
| package.json | ||
| release.sh | ||
README.md
sitespeed.io


![]()
Website | Documentation | Changelog | Twitter
Welcome to the wonderful world of web performance!
Sitespeed.io is a complete web performance tool that helps you measure the performance of your website. What exactly does that mean?
Before we start telling you all about sitespeed.io you should just try it out:
$ docker run --rm -v "$(pwd)":/sitespeed.io sitespeedio/sitespeed.io https://www.sitespeed.io/
Or using npm (you need Chrome or Firefox installed)
$ npm i -g sitespeed.io && sitespeed.io https://www.sitespeed.io/
Ok, now you have tried it, let us tell you more about sitespeed.io. We think of a complete web performance tool as having three key capabilities:
- It test web sites using real browsers, simulating real users connectivity and collect important user centric metrics like Speed Index and First Visual Render.
- It analyse how your page is built and give feedback how you can make it faster for the end user.
- It collect and keep data how your pages is built so you easily can track changes.
What is sitespeed.io good for?
It is usually used in two different areas:
- Running in your continuous integration to find web performance regressions early: on commits or when you move code to your test environment
- Monitoring your performance in production, alerting on regressions.
To understand how sitespeed.io does these things, let's talk about how it works.
First a few key concepts:
- Sitespeed.io is built upon a couple of other Open Source tools in the sitespeed.io suite.
- Browsertime is the tool that drives the browser and collect metrics.
- The Coach knows how to build fast websites and analyse your page and give you feedback what you should change.
- Visual Metrics is metrics collected from a video recording of the browser screen.
- Everything in sitespeed.io is a plugin and they communicate by passing messages on a queue.
When you as user choose to test a URL, this is what happens on a high level:
- sitespeed.io starts and initialise all configured plugins.
- The URL is passed around the plugins through the queue.
- Browsertime gets the URL and opens the browser.
- It starts to record a video of the browser screen.
- The browser access the URL.
- When the page is finished, Browsertime takes a screenshot of the page.
- Then run some JavaScripts to analyse the page (using Coach and Browsertime scripts).
- Stop the video and close the browser.
- Analyse the video to get Visual Metrics like First Visual Change and Speed Index.
- Browsertime passes all metrics and data on the queue so other plugins can use it.
- The HTML/Graphite/InfluxDB plugin collects the metrics in queue.
- When all URLs are tested, sitespeed sends a message telling plugins to summarise the metrics and then render it.
- Plugins pickup the render message and the HTML plugin writes the HTML to disk.
Try it out
Using Docker (use latest Docker):
$ docker run --rm -v "$(pwd)":/sitespeed.io sitespeedio/sitespeed.io https://www.sitespeed.io/
Or install using npm:
$ npm i -g sitespeed.io
Or clone the repo and test the latest changes:
$ git clone https://github.com/sitespeedio/sitespeed.io.git
$ cd sitespeed.io
$ npm install
$ bin/sitespeed.js --help
$ bin/sitespeed.js https://www.sitespeed.io/
More details
Using sitespeed.io you can:
- Test your web site against Web Performance best practices using the Coach.
- Collect Navigation Timing API, User Timing API and Visual Metrics from Firefox/Chrome using Browsertime.
- Run your custom-made JavaScript and collect whichever metric(s) you need.
- Test one or multiple pages, across one or many runs to get more-accurate metrics.
- Create HTML-result pages or store the metrics in Graphite.
- Write your own plugins that can do whatever tests you want/need.
See all the latest changes in the Changelog.
Checkout our example dashboard.sitespeed.io
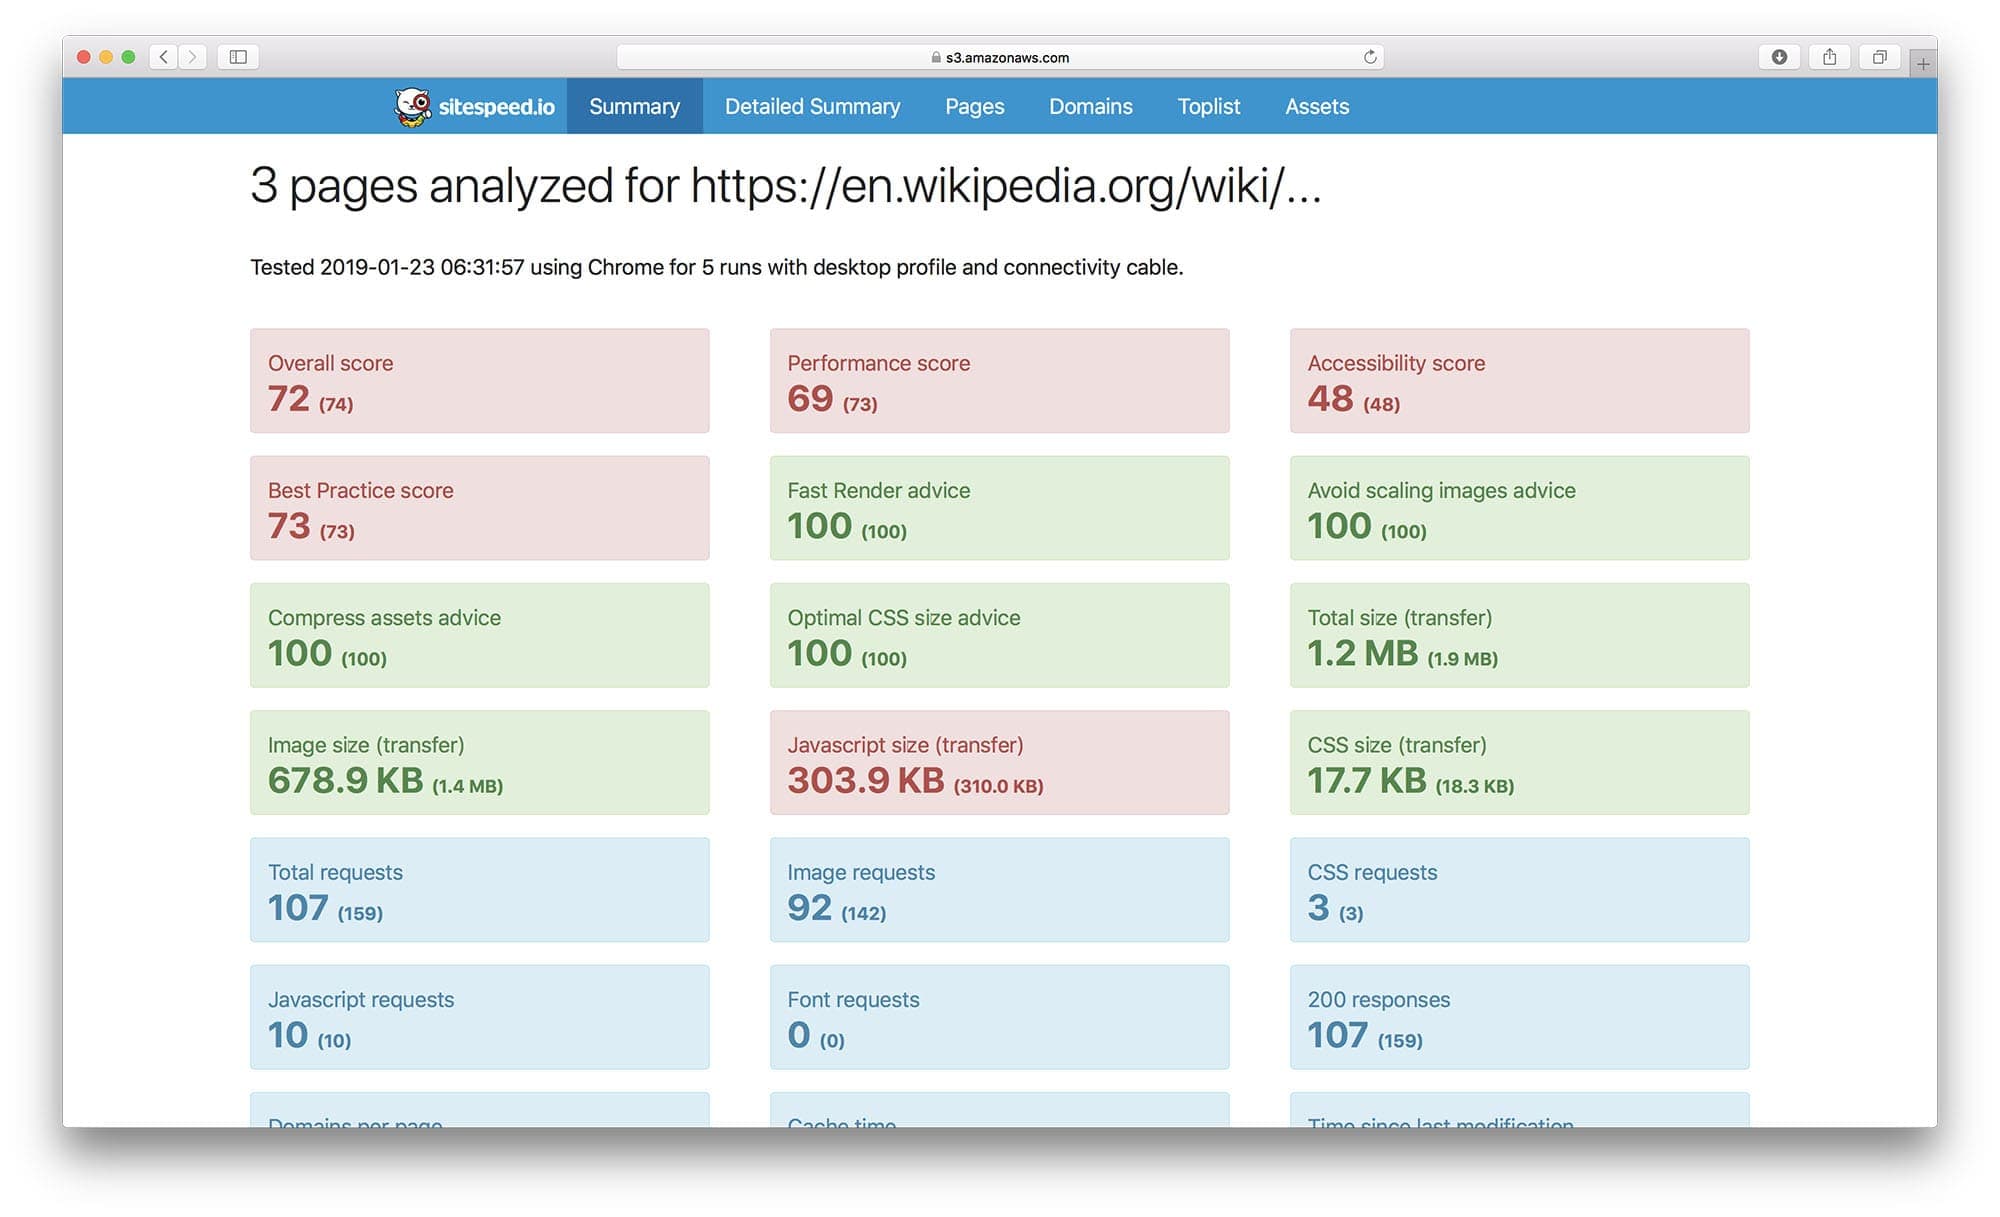
A summary report in HTML:
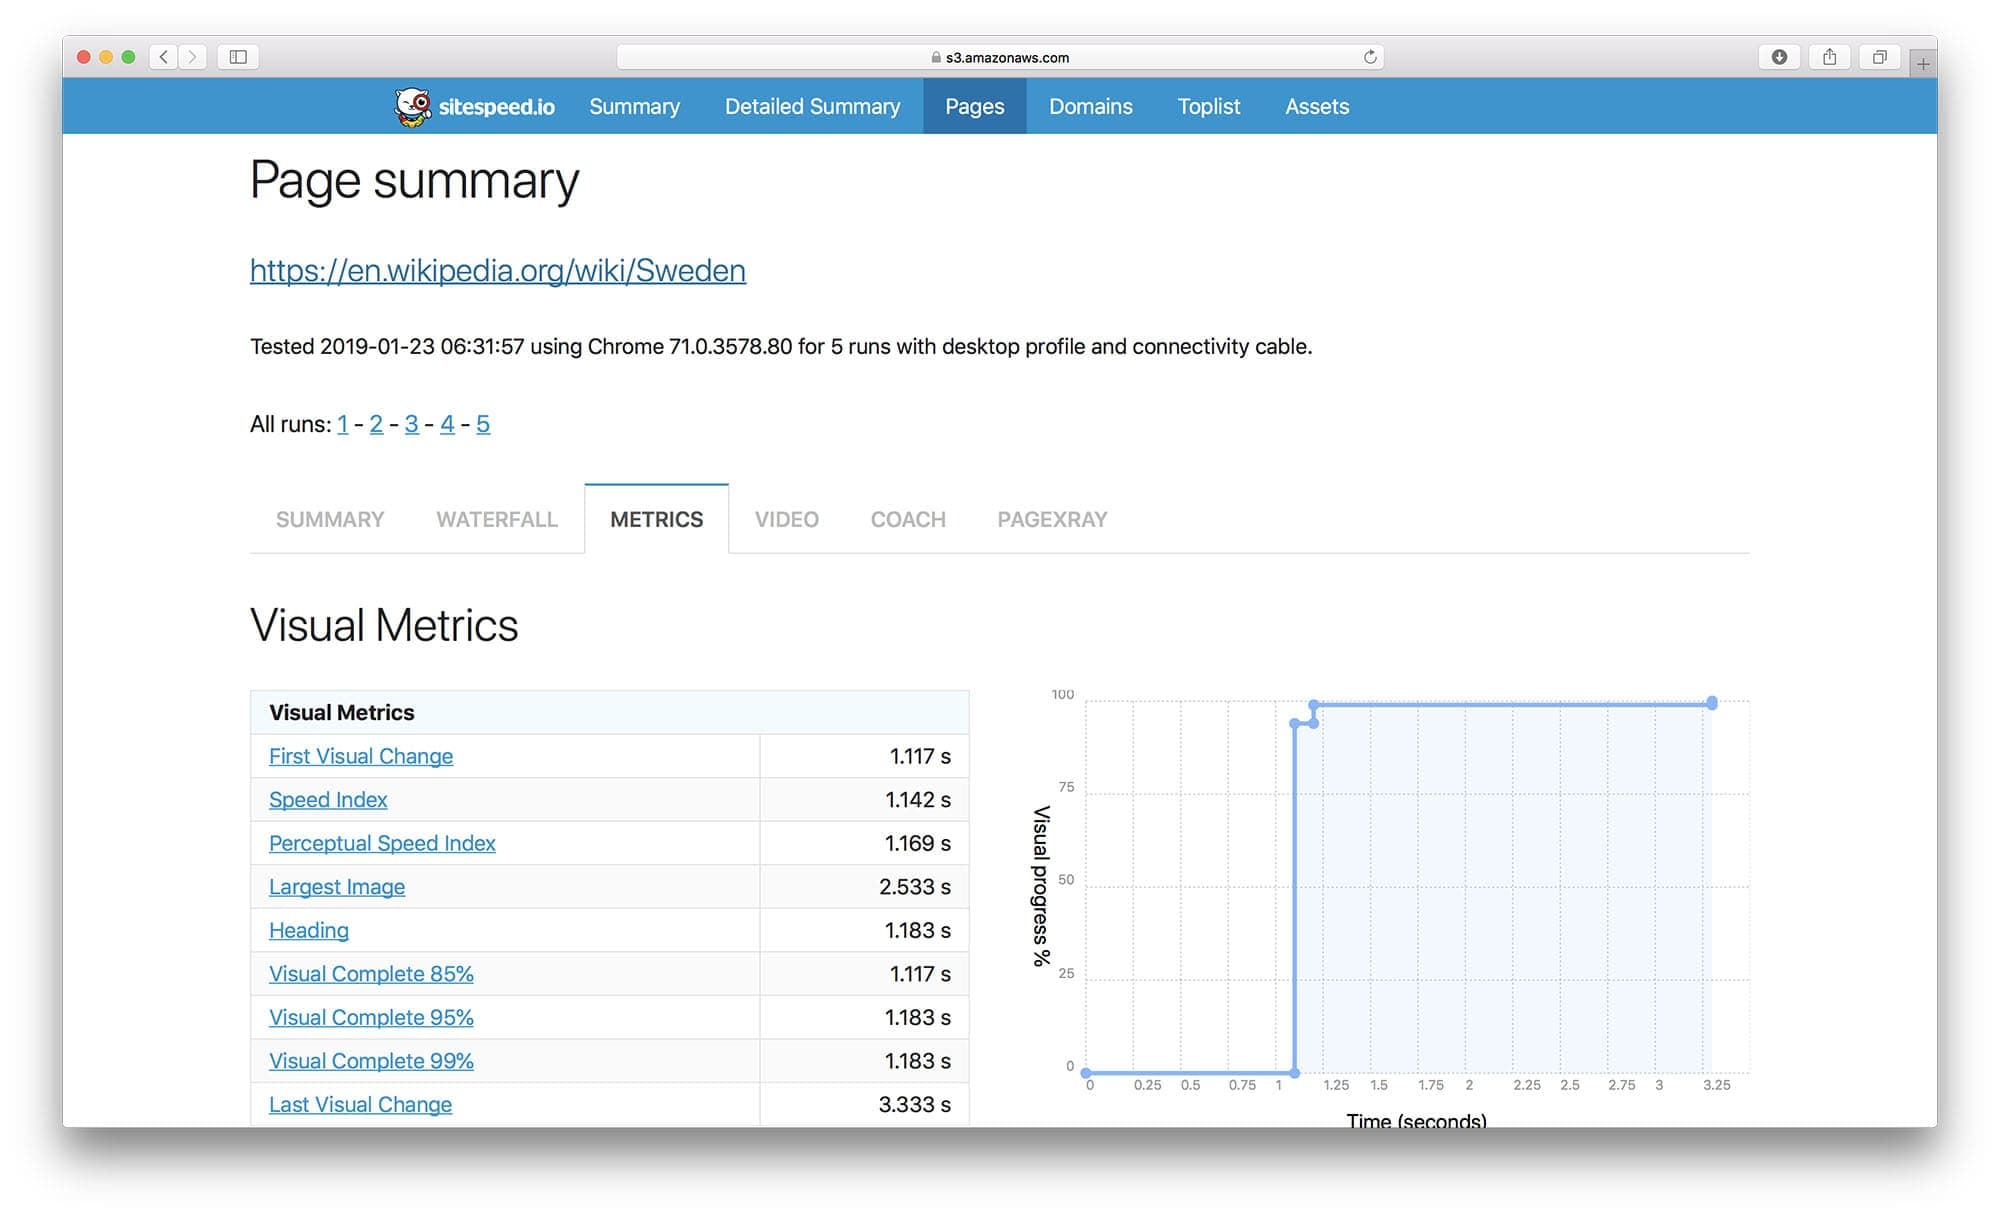
Individual page report:
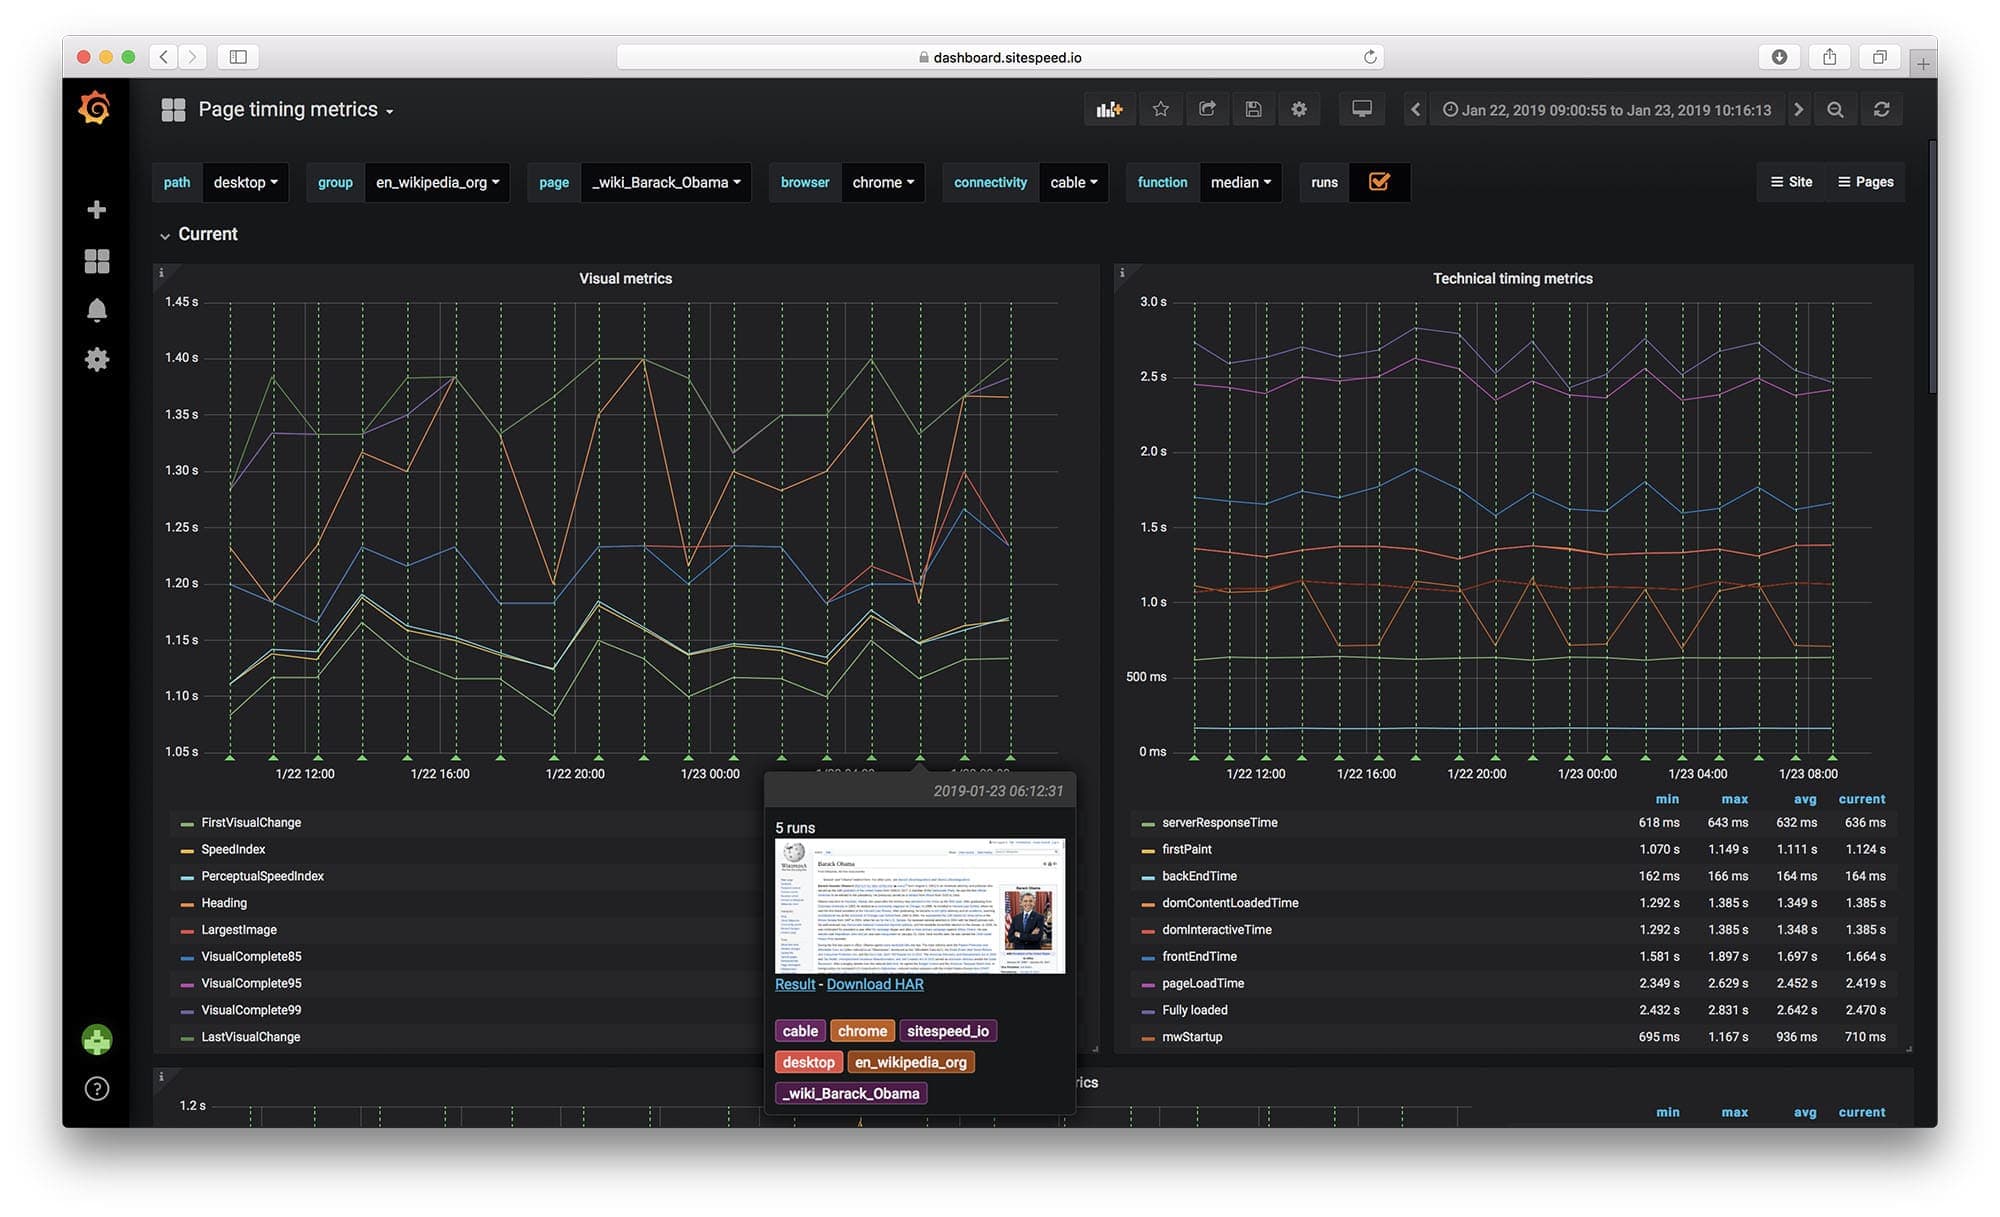
Collected metrics from a URL in Graphite/Grafana:
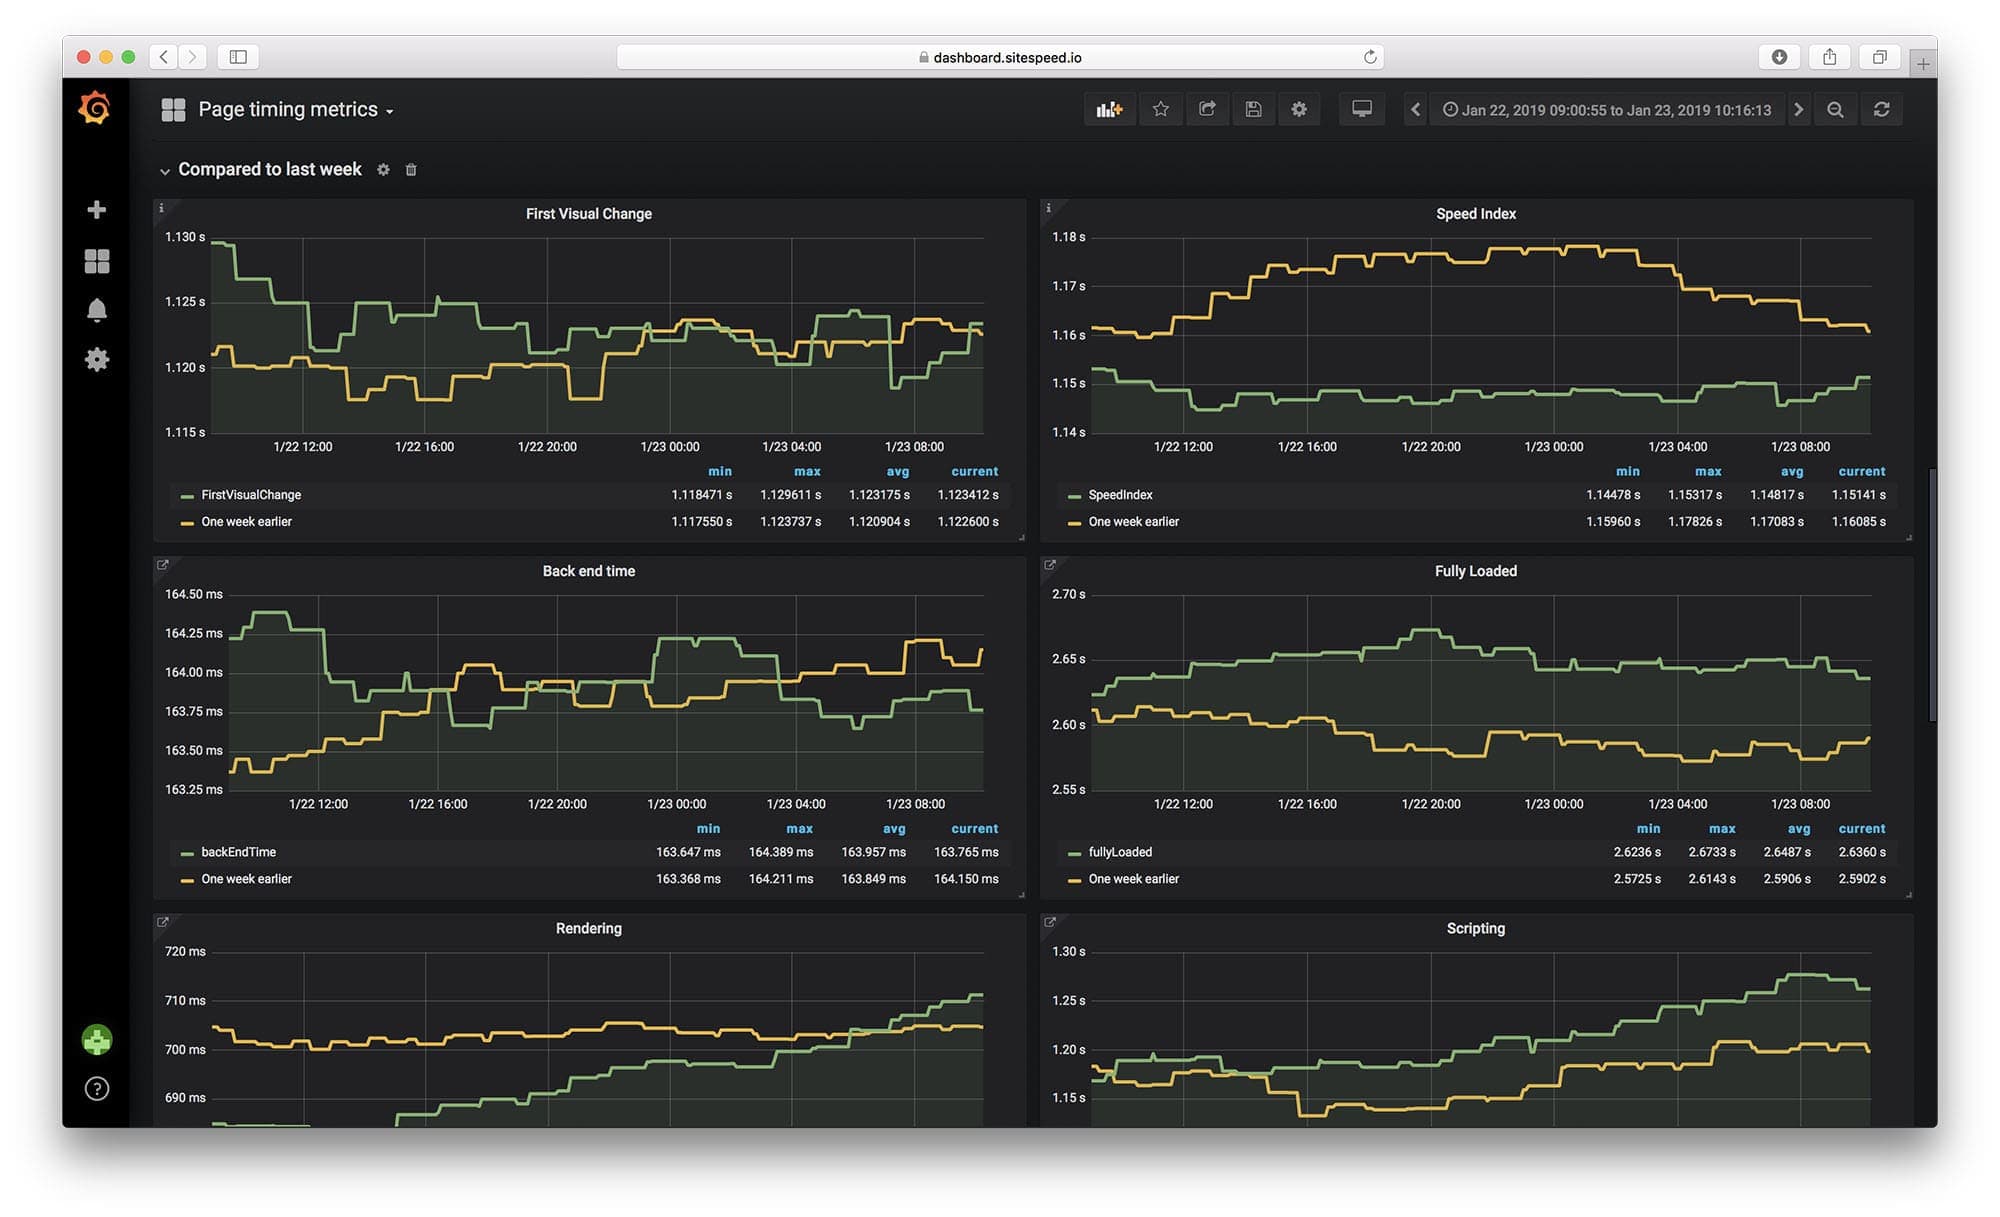
And look at trends in Grafana:
Video - easiest using Docker. This gif is optimized, the quality is much better IRL:

Test using WebPageReplay
We have a special Docker container that comes with WebPageReplay installed. This is a really early alpha release but we think you should try it out.
WebPageReplay will let you replay your page locally (getting rid of server latency etc) and makes it easier to have stable metrics and find front end regressions.
It works like this:
- WebPageReplay is started in record mode
- Browsertime access the URLs you choose one time (so it is recorded)
- WebPageReplay is closed down
- WebPageReplay in replay mode is started
- Sitespeed.io (using Browsertime) test the URL so many times you choose
- WebPageReplay in replay mode is closed down
You can change latency by setting a Docker environment variable. Use REPLAY to turn on the replay functionality.
Default browser is Chrome:
docker run --cap-add=NET_ADMIN --rm -v "$(pwd)":/sitespeed.io -e REPLAY=true -e LATENCY=100 sitespeedio/sitespeed.io -n 5 -b chrome https://en.wikipedia.org/wiki/Barack_Obama
Use Firefox:
docker run --cap-add=NET_ADMIN --rm -v "$(pwd)":/sitespeed.io -e REPLAY=true -e LATENCY=100 sitespeedio/sitespeed.io -n 11 -b firefox https://en.wikipedia.org/wiki/Barack_Obama
https://dashboard.sitespeed.io is supported by:
![]()